")

")
")
Introduction
z value for 90 95 and 99 confidence interval is one of those statistics questions that students, data analysts, and researchers search for constantly. If you’re working on statistics problems, research papers, or data analysis, you’ll eventually face this exact concept.
Table Of Content
Let’s answer the question immediately.
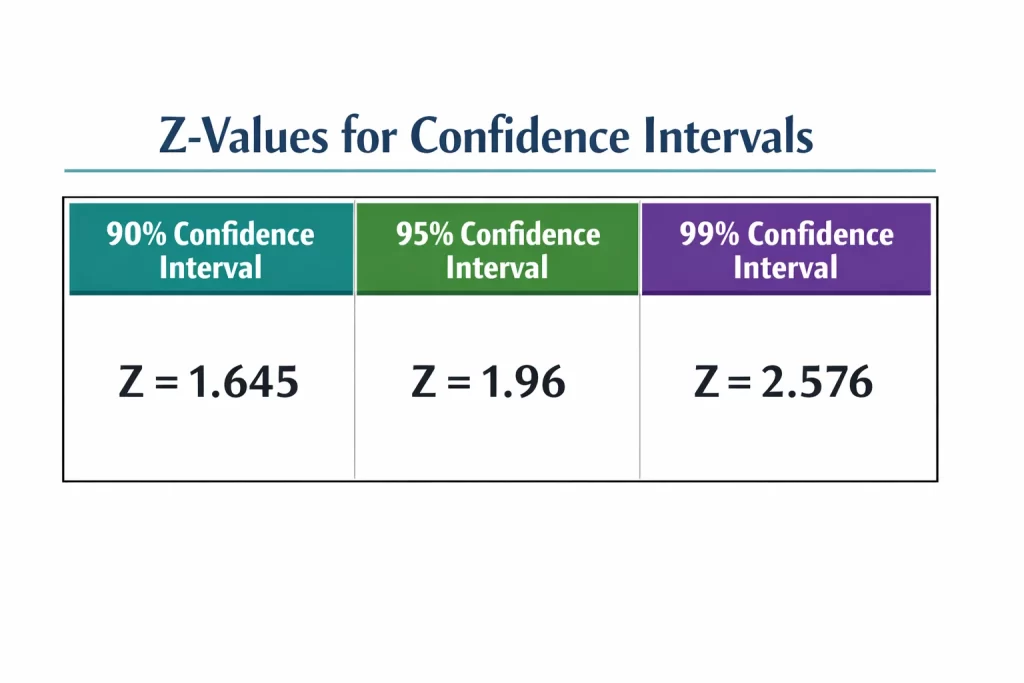
The z value for 90 95 and 99 confidence interval is:
- 90% confidence interval → Z = 1.645
- 95% confidence interval → Z = 1.96
- 99% confidence interval → Z = 2.576
That’s the direct answer. But understanding why these values exist and how they are used is what truly helps you solve statistics problems confidently.
If statistics ever felt confusing or overly mathematical, you’re not alone. Many students struggle with confidence intervals initially. Once you understand how the standard normal distribution works, everything becomes much clearer.
For more statistics explanations and exam-focused guides, you can also explore learning resources at chennaineet.
Key Highlights 📊
Here’s the quick overview you probably came for:
| Confidence Level | Z Value |
|---|---|
| 90% | 1.645 |
| 95% | 1.96 |
| 99% | 2.576 |
These Z scores come from the standard normal distribution and help determine the margin of error in statistical calculations.
What Does a Confidence Interval Actually Mean?
Before diving deeper, let’s clarify something many students misunderstand.
A confidence interval tells you how certain you are about an estimate.
Imagine you survey 1,000 people about their average daily screen time.
Your sample might say:
Average screen time = 5 hours
But you know the true population average might be slightly different.
A confidence interval gives a range like:
5 ± 0.4 hours
So the real value likely falls between:
4.6 to 5.4 hours
The Z value determines how wide that range becomes.
Understanding the z value for 90 95 and 99 confidence interval
When statisticians calculate confidence intervals, they rely on the standard normal distribution (Z distribution).
The distribution looks like a bell-shaped curve.
Key properties:
- Mean = 0
- Standard deviation = 1
- Total probability = 100%
To capture a certain percentage of the data in the middle of this curve, statisticians use Z values.
Example
If you want to capture 95% of the data, you must include values up to 1.96 standard deviations from the mean.
That’s why:
95% confidence interval → Z = 1.96
Z Score for 90 Confidence Interval (Explained Clearly)
Let’s look at the z score for 90 confidence interval.
A 90% confidence level means:
- 90% of the data lies in the center
- 10% remains outside the interval
- Each tail gets 5%
When you check a Z-table, the value that leaves 5% in the tail is:
Z = 1.645
So:
z score for 90 confidence interval = 1.645
This is commonly used in:
- Social science research
- Market surveys
- Preliminary studies
Z Value for 95% Confidence Interval
The 95% confidence interval is the most widely used level in statistics.
Researchers prefer it because it balances accuracy and practicality.
Here’s how it works:
- Total outside area = 5%
- Each tail = 2.5%
Looking at the Z table gives:
Z = 1.96
That’s why:
95% confidence interval → Z value = 1.96
You’ll see this used in:
- Medical studies
- Academic research
- Machine learning experiments
- Government statistics
According to the National Institutes of Health (NIH) and most statistical textbooks, 95% confidence intervals are standard in scientific studies.
Z Value for 99% Confidence Interval
A 99% confidence level means you want very high certainty.
So the interval must be wider.
Here’s the breakdown:
- Total outside probability = 1%
- Each tail = 0.5%
From the Z-table:
Z = 2.576
So:
99% confidence interval → Z value = 2.576
This level is often used in:
- Engineering safety testing
- Financial risk modeling
- High-stakes medical trials
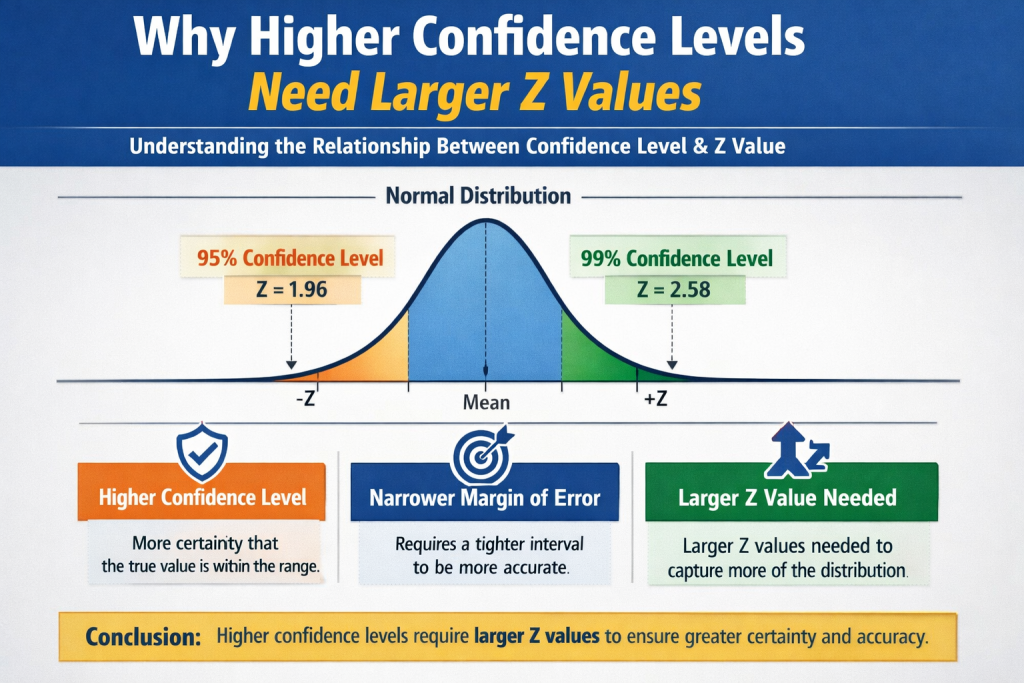
Why Higher Confidence Levels Need Larger Z Values
You might wonder:
Why does the Z value increase when confidence increases?
Simple reason.
You’re capturing more of the distribution.
Example:
| Confidence | Z Value | Interval Width |
|---|---|---|
| 90% | 1.645 | Narrow |
| 95% | 1.96 | Medium |
| 99% | 2.576 | Wide |
Higher confidence = wider range.
This trade-off is unavoidable in statistics.
Real-World Example You Can Relate To
Imagine a tech company testing battery life.
A sample of devices shows:
Average battery life = 10 hours
With a 95% confidence interval, results might be:
10 ± 0.5 hours
Meaning the true value likely lies between:
9.5 to 10.5 hours
But if engineers want 99% certainty, the interval might become:
10 ± 0.8 hours
So the Z value increases, and the interval expands.
Formula Used With Z Values
The most common confidence interval formula is:
CI = x̄ ± Z × (σ / √n)
Where:
- x̄ = sample mean
- Z = Z value
- σ = standard deviation
- n = sample size
Example using 95% CI:
Z = 1.96
This formula is used across:
- Statistics
- Data science
- Economics
- Machine learning
Best Practices When Using Confidence Intervals
If you’re working with statistics regularly, keep these tips in mind:
1️⃣ Use 95% by default
Most research uses 95% confidence intervals.
2️⃣ Use 90% for quick estimates
Often used in market research.
3️⃣ Use 99% for critical systems
Important when safety or financial risk is involved.
4️⃣ Always check sample size
Small samples produce wider intervals.
Common Mistakes Students Make
Many students misunderstand confidence intervals.
Here are typical errors:
❌ Thinking confidence level equals probability of truth
❌ Using the wrong Z value
❌ Forgetting to divide by √n
❌ Confusing Z distribution with t-distribution
Quick rule:
- Large sample → Z distribution
- Small sample → t distribution
Final Answer
The z value for 90 95 and 99 confidence interval is:
- 90% confidence interval → Z = 1.645
- 95% confidence interval → Z = 1.96
- 99% confidence interval → Z = 2.576
These Z scores come from the standard normal distribution and are used to calculate confidence intervals and margins of error.
Conclusion
Statistics often feels intimidating at first. But once you understand the logic behind confidence intervals and Z values, everything becomes much easier.
Now you know exactly:
- What the z value for 90 95 and 99 confidence interval is
- Why those numbers appear in statistics formulas
- When each confidence level is used in real research
With this knowledge, you can confidently solve statistics questions in exams, research work, or data analysis.
If you want more simple explanations for math, statistics, and science topics, you can explore learning resources at NCERT Physics.
")
")
")

")